
Federal executives wanted to quickly understand the health of their entire suite of services so that they could quickly spot and respond to issues.
Role
Information architecture, visual design, data visualization, user research
Team
Front end developers, back end developers, machine learning engineers, business analysts, product manager, product owner, federal executives
Timeline
Six months
QNOD user groups
CMS executives
Centers for Medicare and Medicaid Services (CMS) is the main user group. The project started as a dashboard for CMS executives to understand the health of the entire CCSQ ecosystem at a glance. These users have packed schedules and do not necessarily have the time to participate in user research on their own. We have had the most success getting feedback from CMS through group meetings where we shared design concepts.
Application developers
Application developers also use QNOD although not as much as CMS. These users mostly use QNOD to share the state of their service with CMS since they typically use their own tools such as New Relic or Splunk to monitor their service directly. We had the most success getting feedback from ADOs when working with customer service managers who have relationships with them and by working with CMS to include QNOD feedback tasks on teams’ respective Jira boards during PI planning.
Research phase


Navigation
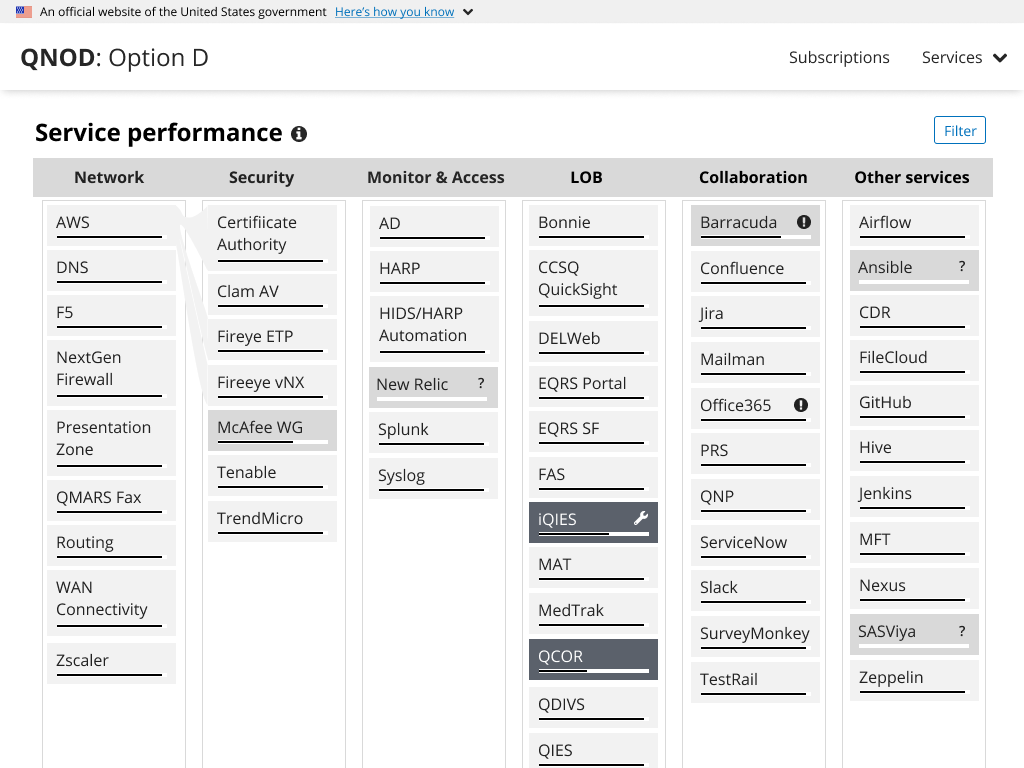
The logo takes you back to the main page with information about the entire CCSQ landscape. The About page gives information about QNOD, answers about metrics and a glossary of terms. The Profile page shows you what capabilities you have in QNOD and lets you manage your alert subscriptions. The Services menu item opens a list of all services. Clicking on the “i” icon next to a title provides additional details.

Tiles
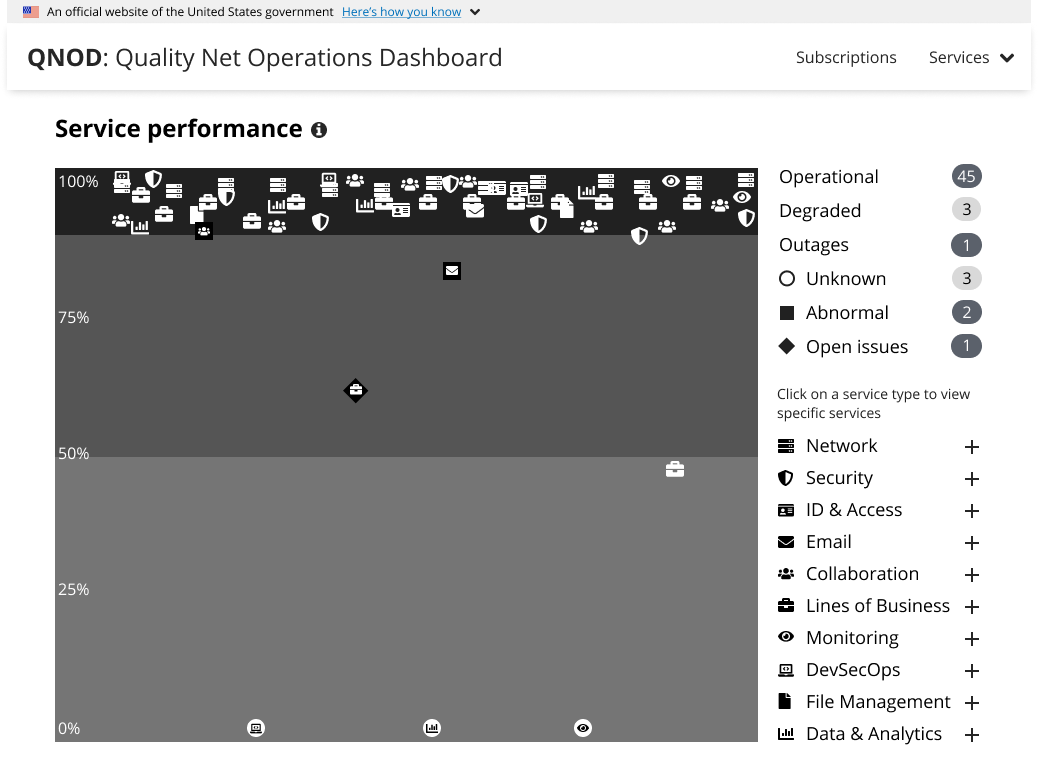
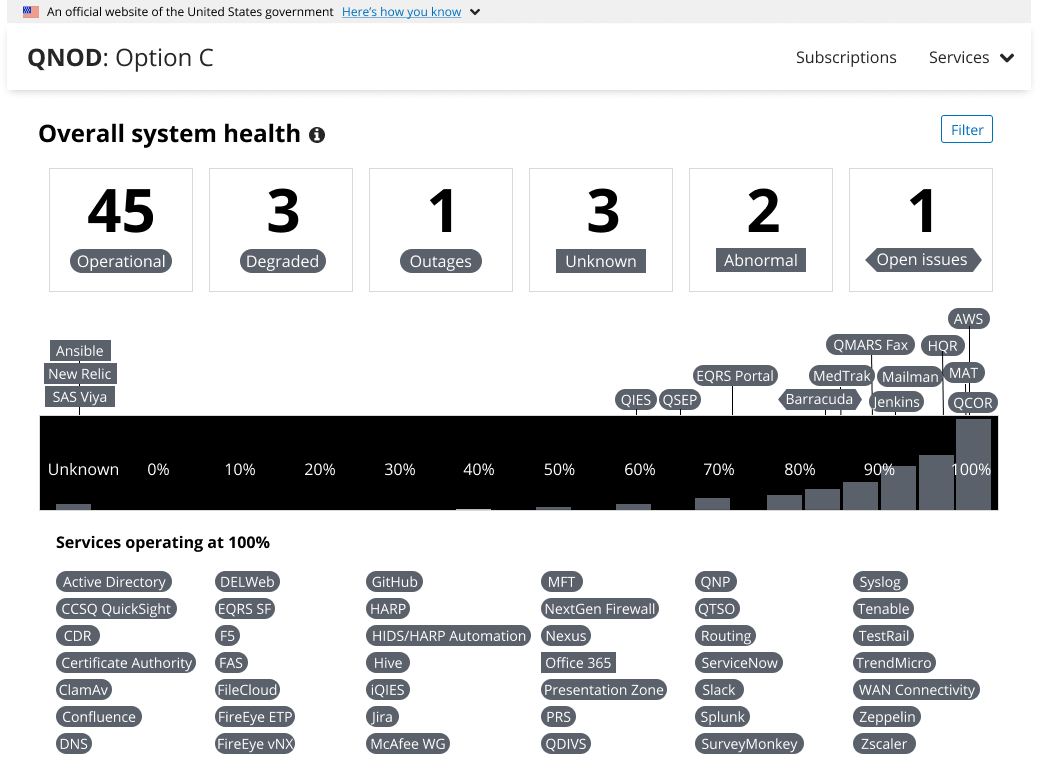
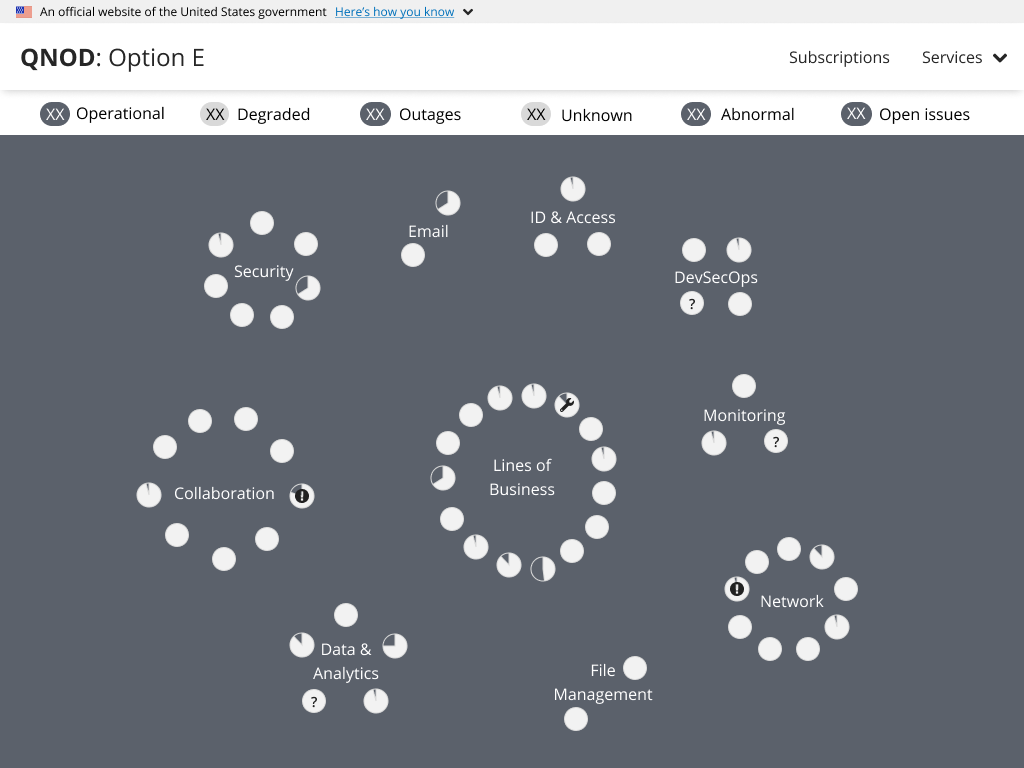
The tiles at the top of the page show how many services fall under each category.
Operational is any service with a health percentage above 65%.
Degraded is a service less than 65% and more than 50%. These services may not be working as well as expected. There could be long load times and system delays.
Outages are services that cannot be used at all. These services have a health percentage of less than 50%.
Unknown means that QNOD is not receiving enough information about the service to determine the health percentage. This situation occurs when the KPI connections used to calculate the health have not received data from the monitoring service. These services could be operating as normal or they could be down.
Abnormal means that QNOD received values significantly different than usual for those services, also known as an anomaly. The reported values could have been better than usual. This does not change the health calculation. A service could be operational and abnormal at the same time.
The numbers in the tiles can add up to more than the number of services because “Open Issues” and “Abnormal” are additional details about a service.
Service spread
This graph shows the overall view of the CCSQ landscape. The color of each service matches the color of its health category. A service with a rounded shape means that it doesn’t have any reported anomalies or Jira issues. A service that is “Abnormal” will have a rectangular shape; a service with “Open issues” will have a diamond shape.
Services are located in order of their health percentage using the values in the histogram chart below starting with “Unknown”. Services with lower health percentages appear further to the left; services with higher health percentages appear further to the right. Services with perfect health scores appear in the accordion below the histogram.
The histogram shows the number of services within each range. Ideally, more services will appear on the right side of the chart than the left. The range of values starts with the current lowest available value for any service. This means that the values in the chart may start at a higher percentage than expected and will change depending on the current services’ health percentages.
Accordion
Any service that is operating at 100% health are displayed in this section in alphabetical order. This section can be collapsed and expanded.


Tiles
Health is the current health percentage for the service. This number is calculated from all the KPI reporting into the service.
Availability shows the percentage of time that the service was working over the past 30 days. Any time that the service had an outage is used to calculate this number.
Days Up is the number of days since a service last had an outage whether that outage was unplanned or expected maintenance.
Anomalies shows how many times that a service had abnormal values reported over the past 24 hours.
KPI connections shows the number of queries to monitoring services.
Open issues is the number of open Jira stories related to service issues.
Health composite
This chart shows the trend of service’s health through the categories that make up the health: synthetics, application, compute and network. Each bar has a maximum value of 100. Each segment of the bar shows how each category contributes to the overall health.
Anomalies
This chart shows the length of time and when anomalies occurred during the past 24 hours in gold.
KPI connections
These show which monitoring sources are used by each KPI. Each KPI also shows the last time the feed was received and how frequently the feed is scheduled to update.
Open issues
Each open Jira is listed with a link to the Jira story, the ID of the story, a short description and its status.

Profile page
The profile page shows users their role in QNOD and allows them to manage their site preferences. For the initial version, users will be able to customize service alerts based on KPI thresholds and timing. In the future, users could set favorite services, change color schemes or choose different views.
Results
Ability to see health of the entire suite at a single glance
Multiple levels of detail for different users